Panels
The shape every analysis ROI shares, and the way into the ROI manager and the evaluation of the sites.
Many experiments image many copies of one structure – nuclear pores, clathrin pits, centrioles – and the question is about all of them: how big, how many molecules, how often a ring is complete. The way to answer it is to mark each copy with a small region, an ROI (region of interest), measure what is inside each one, and summarise the measurements. A marked copy is called a site.
The ROI tab is where that begins. It holds what all ROIs share – their shape and size – and opens the two windows the work is done in: the ROI manager, where sites are found, drawn, included or excluded, and looked at one by one, and the evaluation window, where the measurements to make on every site are chosen and run. Below the tab's own controls sit the ROI plugins pinned to it. By default these are the ones that find sites – Density Peaks for any compact structure, NPC for nuclear pores – the ones that summarise the measurements – Histograms and NPC Labeling Efficiency – and NPC Analysis, which finds the pores, measures them and fits their labelling efficiency in one run.
An ROI sees what the image shows: the localizations of its file that pass a layer's filter, grouped if that layer is grouped. So clean the data in the Render tab first; there is no separate filter for ROIs. The ROIs, their measurements and the evaluation settings are saved into the localization file with File > Save and come back when it is opened.
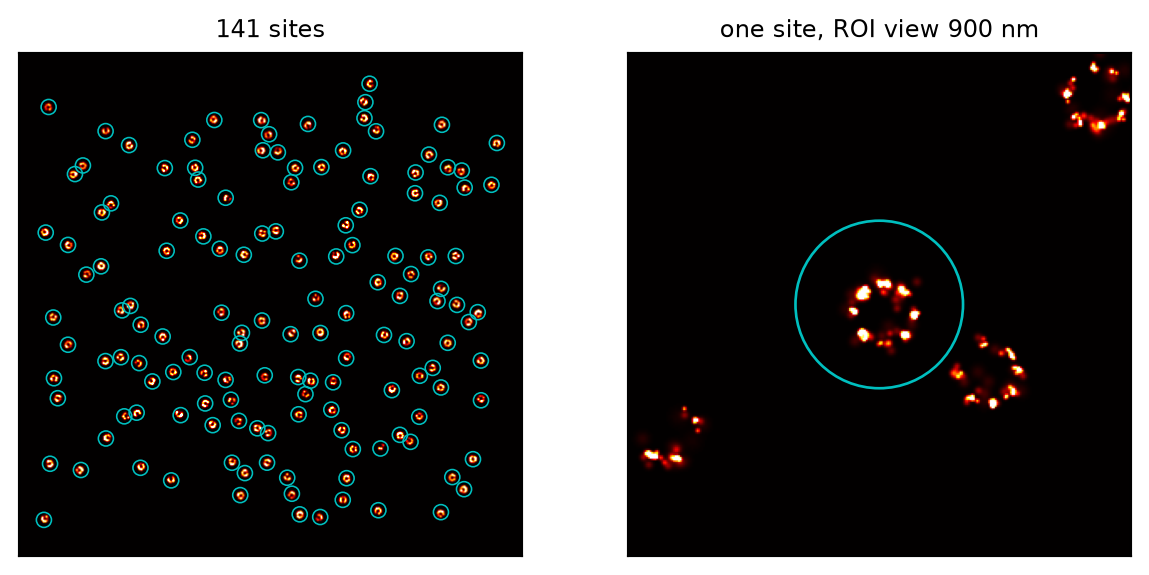
1. Sites. ROIs are made in the ROI manager: found automatically, clicked by hand, or taken from a region drawn in the 2D view (Add the drawn region as an ROI). Each ROI is a centre in one file; its outline is the shape and size set here, the same for all of them, unless the ROI has an outline of its own (a polygon).
Left: simulated nuclear pores, with the ROIs Density Peaks proposed on them, each a circle of the default 300 nm. Right: one site as the ROI manager shows it – a field three ROIs wide around the ROI, with its neighbour outside.
2. The shape decides what is measured. A localization belongs to a site if it lies inside the ROI's outline, boundary included. The outline is a circle of the given diameter or a square of the given side, around the ROI's centre; an ROI with its own polygon uses that instead. ROIs may overlap, and a localization in the overlap counts for both. Make the ROI large enough to hold the whole structure with its scatter, and small enough to leave the neighbours out.
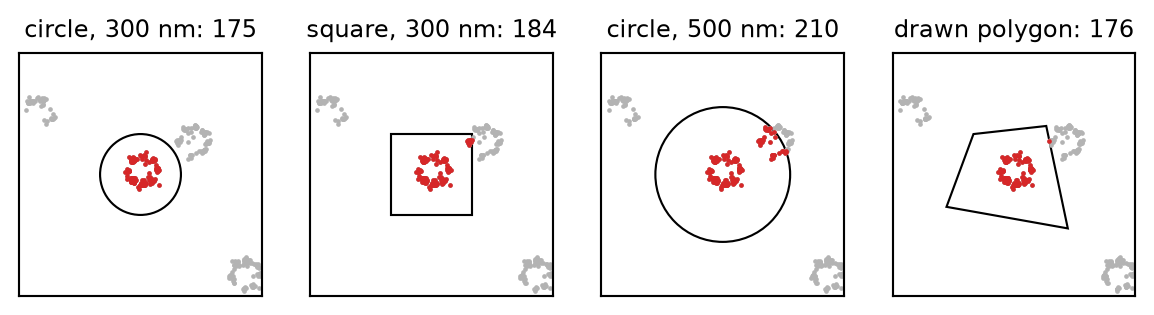
The same site with four outlines: the localizations counted (red) and the ones left out (grey). The square's corners and the larger circle reach the neighbouring pore; a polygon drawn in the 2D view keeps its own outline whatever the shape and size.
3. Evaluation. Evaluation pipeline... opens a window with a list of evaluators: plugins that measure one site and return a row of numbers for it (the built-in one, Statistics, counts the localizations and averages their precision and photons). The list is run over every included ROI of every file, one row per site; together the rows are the site table, which the Analyze plugins such as Histograms summarise.
4. What is still true. Each stored measurement remembers what it was made from: the file's data, the ROI and its geometry, the filter, the grouping, and the evaluator with its version and settings. When the data an ROI sees change – a new size here, a new filter bound, a drift correction – its measurements are marked out of date and left out of the site table until the sites are evaluated again. A measurement belongs to its ROI, whether the evaluation window or a chain made it, and evaluations under different names stand side by side in the site table.
Inside an ROI. For an ROI with centre  and size
  , a localization at
  is inside a circle if

and inside a square if  and
and  . A polygon uses the even-odd rule, with points on an edge counted as inside. Only localizations that pass the filter are considered; they are looked up through a spatial index over the ROI's bounding box first, so the test runs on a few hundred points rather than on the whole table. Coordinates are in nanometres, whatever the Render tab's axes show.
The data an ROI sees. The session's table, cut to the ROI's own file (an ROI knows its file, so the layer's choice of files is ignored), filtered by the first localization layer's bounds and grouped if that layer is grouped. On a grouped layer a site's count is a count of blinks, and its photons are the blinks' summed photons.
A drawn region. Add the drawn region as an ROI turns the region drawn in the 2D view into an ROI of the file chosen in the ROI manager: a rectangle becomes its four corners, a line the rectangle of its width around it, a polygon its vertices. The ROI's centre is the mean of the vertices. Such an ROI keeps its outline when the shape or size is changed here.
What is out of date. A stored measurement is signed with a digest of its inputs – the data's fingerprint (row count, columns and a sample of the positions), the ROI's geometry, the filter bounds, the grouping and its parameters – together with the evaluator, its version and its settings, but not its name. A step of the pipeline is current when that signature matches what it would be now, and stale when not; the check is per step, so changing one evaluator's settings leaves the others' numbers standing. The site table is looser: it holds every measurement still true of the ROI's data, the newest under each evaluation's name, with the settings it was made with. Changing the size or shape here makes the measurements of every circle and square ROI stale, but not those of polygon ROIs.
Which ROIs count. Every ROI counts from the moment it is made; the use tick in the ROI manager is what excludes one. Evaluation and the site table pass over excluded ROIs; their earlier results stay in the file.
The window where ROIs are found, drawn, moved, included or excluded, and where each site is shown with what the evaluators measured on it (also Tools > ROI manager, Ctrl+R). Under the button, the file chosen there and how many of its ROIs there are and are used.
What every ROI's outline is, unless it has a polygon of its own.
circle for round structures; square for structures that are square or when the corners do not matter. A square of side  is 27 % larger in area than a circle of diameter
  , so its corners reach further towards a neighbour.
The circle's diameter, or the square's side. Start at about twice the structure's diameter: the default 300 nm fits a nuclear pore (about 110 nm) with room for the localization scatter and a misplaced centre. Too small, and the edge of the structure is cut off where the centre is off; too large, and neighbours and background come in. Changing it applies to every circle and square ROI and puts their measurements out of date.
A display setting only: it changes nothing that is measured. The width of the field the ROI manager shows around the selected ROI. At 0 it is three times the ROI size. Wider shows more context; narrower, more detail of the site.
Draw a rectangle, a line or a polygon in the 2D view first. Useful for structures that are not round, or a region the automatic finder would not propose; the outline is kept as it is.
The measurements. The table lists what was measured on the ROI selected in the ROI manager, one line per number, marked with its state – (stale), say – where the step that produced it is not current; below it, how many sites have a complete, current row in the site table.
Opens the evaluation window: which evaluators run, in what order, with which settings, and the buttons that run them on every ROI or re-run only what changed. A new pipeline starts with the general evaluators, once each; a specialised one, such as NPC Corners, is added here when the data call for it. The pipeline is saved in the file with the results, because the site table's columns mean nothing without it.
Based on SMAP's ROI manager (the SiteExplorer, with its ROIManager plugins) (Ries 2020).