ROIManager › Analyze · version 1
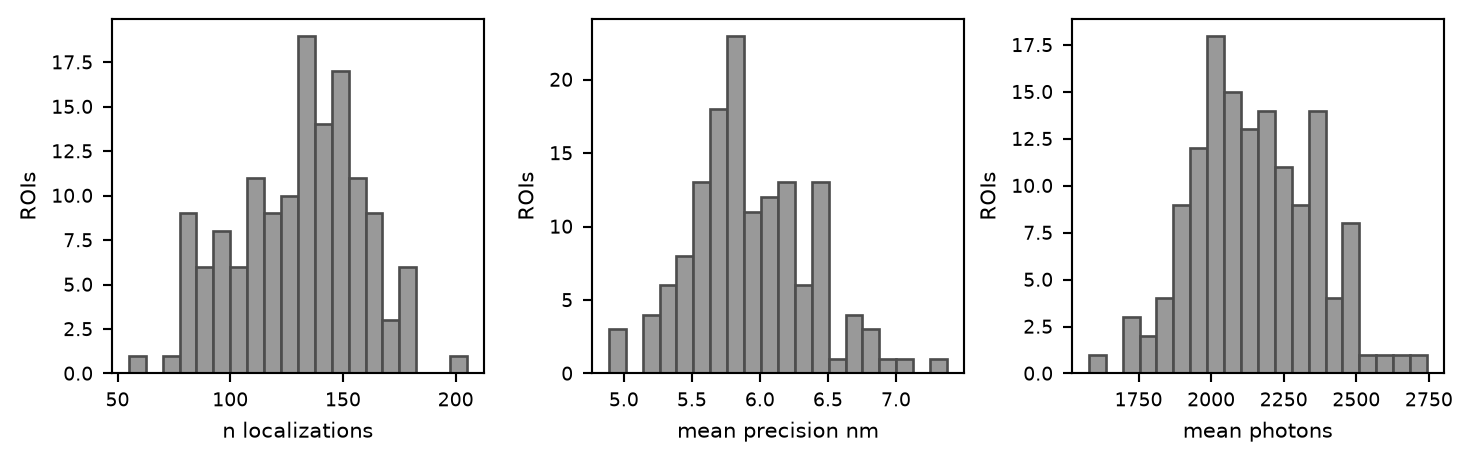
Distributions of the evaluation results, one histogram per column.
The ROI manager works in three steps: sites are found (Density Peaks, or by hand), each site is evaluated by plugins that run once per ROI (such as Statistics), and the collection of results is analysed. Evaluation leaves a site table: one row per site, one column per number an evaluator returned.
Histograms is the simplest analysis of that table. It draws, for each column, how the values are distributed over the sites. That is where a population shows itself: the typical number of localizations of a nuclear pore, how much it varies, and which sites are outliers – empty, doubled, on background – and deserve a look before they go into an average.
It needs a site table: evaluate the sites first.
1. The site table. The rows are the current results of every included site (use ticked). A site whose result is out of date – the ROI was moved, a filter or an evaluator's setting changed – is left out until it is evaluated again. A site where an evaluator failed has no values for that evaluator's columns, and no row at all if nothing else ran. Nothing is evaluated here: the histograms show what the table holds when the plugin is run, and are a snapshot.
2. The columns. With columns empty, every column that holds a number in every row is drawn, except the site and file identifiers. Otherwise the columns named, in that order.
3. The histograms. Each column's values are split into bins equal bins from the smallest to the largest value, and the number of sites in each bin is drawn, one panel per column.
The histograms drawn for about 140 simulated nuclear pores (Nup96, 60 % labelling) evaluated with Statistics, one panel per column (the plugin stacks them; here they are side by side). The number of localizations per pore varies several-fold, from the random labelling and blinking alone; precision and photons, which are averages over a site, vary much less.
Which columns. A column is taken by default when the first row has it and every row holds an integer or a floating-point number there (a NaN counts as a number; True/False and text do not). roi_id and file_id are never drawn. The rows' columns are stored in alphabetical order, and the panels follow it. With Statistics the default columns are five: the three numbers and the two counts of finite values behind the means (mean_photons_n, mean_precision_nm_n), which equal n_localizations unless the table holds NaNs. Name the columns to leave those out.
Missing values. A value that is not finite (NaN, or a row without that column) is left out of its histogram, and the panel's title says how many were missing.
Bins. The bins are  equal intervals from the smallest to the largest finite value, as
 numpy.histogram makes them; the largest value falls into the last bin.
Two evaluators with the same column. When two evaluators in the pipeline return a column of the same name, the site table keeps both, prefixed with the evaluator's label (label.column), and that is the name to give in columns.
| setting | default | what it does |
|---|---|---|
binsbins | 20 | Number of equal-width bins, spanning each column's smallest to largest value. Around the square root of the number of sites is a fair start: 10 for 100 sites, 30 for 1000. Too many leaves most bins with one site or none; too few hides a second population. at least 1 |
columnsfields | – | Comma separated; empty means every numeric column but the counts behind the means. Names as in the site table, for example |
results fromevaluation | auto | The evaluation whose columns are drawn; auto: every evaluation on the ROIs. auto for an overview of everything measured. The list offers every evaluation on the ROIs; pick one to see only its columns, under their own names – one of two settings of the same evaluator, say, when both are on the ROIs. |
roi_ids), and the number missing; and the rows themselves.A population of similar structures gives one peak per column. A second peak at twice the typical count suggests sites holding two structures; a tail at low counts, sites on background or on incompletely labelled structures.
SMAP has no plugin of this name; its site results are looked at in the ROI manager's evaluation window or taken out with ROIManager/Analyze/ExportEvaluationsTable, a table of one evaluator's results to plot elsewhere (Ries 2020). This plots the columns of the whole pipeline's site table directly, and leaves out sites whose result is out of date.