Panels
The window where sites are found, looked at one by one, kept or excluded, and evaluated.
Many SMLM experiments image the same small structure hundreds of times: nuclear pores, clathrin-coated pits, centrioles. The answer is then not one image but a table, one row per structure, and a distribution over the rows. The ROI manager is where that table is built. Each structure gets a region of interest (ROI), also called a site. You look at the sites one after another, keep the good ones, exclude the bad ones, and let evaluators measure each one.
The work goes in four steps:
What the ROI tab holds is what an ROI is: its shape and size, shared by all ROIs, and the plugins that find and summarise. This window is for choosing and judging.
An ROI sees the localizations the image shows. The first layer's filters and its grouping in the Render tab apply to every ROI, so a filter on precision or photons is set there, once. The images in this window are drawn with that layer's settings too.
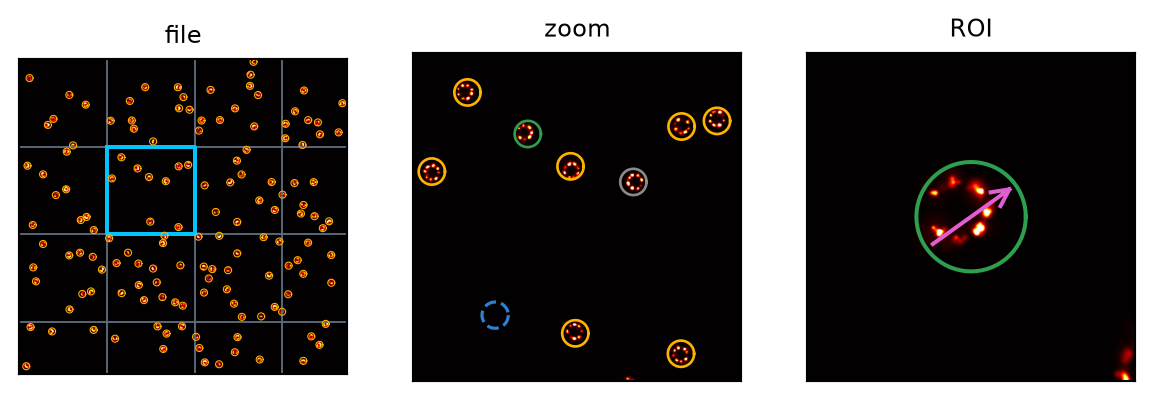
1. Three images and a list. The window has four quadrants. At the top left is the whole file, at the top right a zoom, at the bottom right the ROI being looked at, and at the bottom left the files and the ROIs. A click in the file moves the zoom there. Moving around never moves an ROI.
2. Finding sites. A segmentation plugin run from the ROI tab adds its candidates to the file shown here. A click on empty space in the zoom drafts an ROI by hand (blue, dashed); Add stores it. A click on an ROI's outline selects it, while a click inside one drafts a new ROI, so that overlapping ROIs can be drawn.
3. A systematic walk. Tiles lays a grid over the file. The arrow keys step the zoom from one square to the next, row by row, so that every part of the data is looked at once, in a fixed order, and not only where the eye happened to land.
Simulated nuclear pores (Nup96, 60 % labelling) after Density Peaks, with ROIs of 200 nm. Left: the file, every site found (amber) and a grid of 2.5 µm tiles, the current one in cyan. Middle: the zoom on that tile, with a site excluded from use (grey), the selected site (green) and a draft not yet added (blue, dashed). Right: the ROI image of the selected site, three ROI widths across, with a direction drawn on it (magenta).
4. Reviewing. Selecting an ROI in the list shows its file, centres the zoom on it and draws it in the ROI image. The use box in the list, or the space bar, includes or excludes it. An excluded ROI stays in the list, grey, and is left out of the evaluation and the results. An ROI counts as reviewed from the moment it is made: there is no separate review flag in the window, and use is the decision.
5. Shapes. All ROIs share the circle or square set in the ROI tab. One ROI can have its own outline instead (Polygon), and a direction (Direction), an arrow that evaluators can read, for example as the axis of an elongated structure.
6. Evaluating. Evaluation pipeline... opens the window where the evaluators are chosen, ordered and set up, and run over every ROI. With plot the evaluation ticked, a second window shows what the evaluators draw for the selected ROI, one tab per evaluator. Stepping down the list redraws it in place, so that sites are compared like with like.
7. Out of date. Every result is stored with a record of what it was computed from. When the ROI's data change – the ROI moved, the data were corrected, a filter was edited – its results no longer describe it: its number in the list turns orange, the status bar counts how many wait, and the ROI drops out of the results until it is evaluated again. Editing an evaluator's parameter also turns every ROI orange, since the pipeline would now compute something else, but the results it has stay in the table until then: they are still true of the ROI, made with the old settings, and say so.
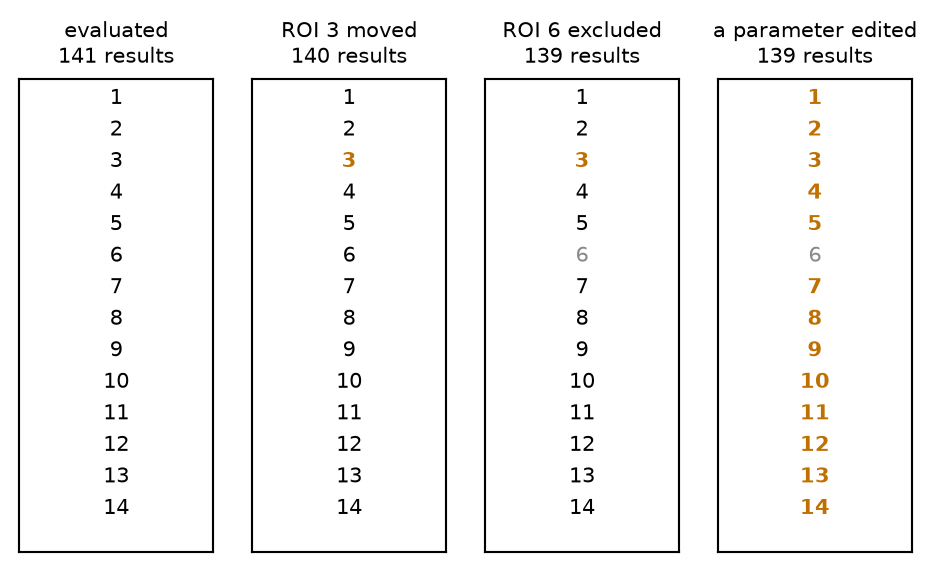
The first 14 numbers of the ROI list, and the size of the result table, through four edits: after an evaluation with Statistics everything is current (black); moving ROI 3 by 40 nm puts only that ROI out of date (orange) and out of the results; excluding ROI 6 greys it and takes it out of the results; editing a parameter of the evaluator puts every included ROI out of date, while the results made with the old setting stay until they are replaced.
8. Saving. The ROIs are part of the session. File > Save writes them into the localization file, with their shapes, the use flags, how each was found, the evaluation runs, the pipeline and where the window was, and opening the file brings them back. A draft that was not added is not saved.
Which localizations an ROI holds. A circle of diameter  holds the localizations with
  , a square of side
  those with
  and
and 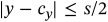 , and a polygon those inside it by the even-odd rule, edges included. Only rows that pass the layer's filter count, from the grouped table when the layer is grouped. Overlapping ROIs are independent: a localization in the overlap belongs to both. An ROI belongs to one file and only sees that file's localizations.
Selecting on the outline. A click selects the ROI whose outline is within 6 screen pixels of it, the nearest one if there are several. For a circle that distance is 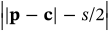 , for a square and a polygon the distance to the nearest edge. A click on a tile's edge in the file image (also within 6 pixels) jumps to that tile; a click inside a tile just centres the zoom.
Tiles. The grid starts at the lower corner of the file's extent and has  by
by  squares of side
  , numbered row by row. It is not stored: it follows the file and the one size, so it never goes out of date. The walk wraps from the last tile to the first, and a new file starts at its first tile.
What a result depends on. For each ROI and each step of the pipeline the result is stored with a signature, a hash of
For the pipeline, a step is current when a result with the same signature exists, out of date when there is one under the step's name with another signature, and missing otherwise. Results of an evaluator that is not installed here cannot be checked and are unverified. An ROI is waiting (orange) when it is included and any step is not current. Because the signature is the content and not the name, evaluating a renamed step with unchanged settings copies the numbers rather than measuring again, and changing the global ROI size does not affect ROIs with their own polygon.
What the result table holds. A result belongs to its ROI, whoever ran it – this pipeline, a chain, a script. An ROI's row holds, under each evaluation's name, the newest result that was computed from the ROI's data as they are now (the signature without the evaluator part); the pipeline's evaluations come first. The name is what tells two evaluations apart: running the same evaluator again under its name replaces its numbers, and running it renamed, with other settings, puts a second set beside the first, so the two can be compared. A column keeps its plain name while only one evaluation writes it, and is called <name>.<column> when two do. Each result keeps the settings it was made with, which is what an analysis such as NPC Labeling Efficiency reads its cutoffs from.
What runs when a site is selected. With plot the evaluation on, the evaluator whose tab is open is always run on the selected ROI, because a figure cannot be stored and has to be drawn from the data. The other evaluators run only if their stored result is out of date and re-evaluate when out of date is ticked; what runs then is stored as a one-site run, so the same work is not done again on the next visit. An evaluator re-run only for its figure, with an unchanged result, is not stored again. With re-evaluate when out of date unticked nothing else runs: stored results are shown as they are, still marked as out of date. A step that fails costs its own columns, not the ROI or the other steps, and its tab turns orange with the error in it.
The whole file, with every ROI and, with Tiles on, the grid. The yellow frame is what the zoom shows. Click to centre the zoom there.
Three micrometres across to start with. The wheel zooms, a drag pans, and a click drafts an ROI or, on an outline, selects one. An ROI is drawn amber when included, grey when excluded and green when selected.
The selected ROI or the draft, as wide as the ROI tab's ROI view (three ROI sizes by default); the wheel here changes that width for all ROIs. A click moves a draft. It is also where Polygon and Direction are drawn.
Covers the file with a grid of squares of the size beside it and puts the zoom on the first. < and > beside it, or the left and right arrow keys, step to the previous and next tile. A tile about ten times the size of a structure keeps each step to a few dozen sites.
Stores the draft as an ROI, with its polygon and direction if it has them. Enter does the same.
Deletes the selected ROI. To keep an ROI out of the analysis without losing it, untick use instead.
Click once per vertex in the ROI image; clicking near the first vertex again, after at least three, closes the outline, and Escape abandons it. The ROI's centre moves to the mean of the vertices. On a draft, the outline goes with it when it is added.
Two clicks, the start and then the end. The arrow is stored with the ROI and handed to the evaluators; it does not turn the image or the ROI.
Back to the circle or square of the ROI tab.
Removes the direction.
The same window as the ROI tab's button of that name. Re-evaluate what changed there runs only the steps that are out of date, which after one edited parameter is one evaluator over the sites rather than the whole pipeline.
Opens the evaluation window beside this one. Closing that window unticks it. Its tabs appear only for the evaluators enabled in the pipeline.
On by default. Untick it to scroll a large project quickly: nothing is then computed behind you except the figure of the open tab.
Based on SMAP's ROI manager, the site explorer (Ries 2020), its SEExploreGui and SEEvaluationGui: the images beside the lists, the global site size, the use flag and a pipeline of evaluators with a tab each are its design.