ROIManager › Segment · version 1
Proposes ROIs where localizations pile up, after a Gaussian blur.
Many SMLM experiments image the same small structure hundreds of times over one cell: nuclear pore complexes, clathrin-coated pits, centrioles, kinetochores. The ROI manager analyses them one by one. It first needs a list of sites: one region of interest (ROI) centred on each structure. Clicking hundreds of them by hand is slow, and not reproducible.
Density Peaks proposes those sites automatically. It looks for places where localizations pile up, and puts an ROI on each one that holds enough localizations and is not too close to another. It is the first of the ROI manager's three steps:
Use it for compact, well separated structures of roughly 50 to 200 nm, on a low background. It looks only at how dense the localizations are, not at their shape. A ring, a blob and a piece of filament are all the same to it, so on filaments or a dense meshwork it puts sites along every line (see the second figure). The ROIs it adds can be removed, or excluded with use, in the ROI manager like any other.
Despite the name, this is not the "density peaks" clustering of Rodriguez & Laio 2014. It is a blurred density image, its local maxima, and a count threshold.
1. A density image. The localizations are binned into an image with pixels of bin (20 nm). Each pixel holds the number of localizations that fell into it.
2. Blur. The image is smoothed with a Gaussian of width smoothing (50 nm). A single structure then becomes one smooth hill, however its localizations are arranged inside it. A nuclear pore, a ring of about 110 nm across, turns into one peak at its centre.
3. Local maxima. Every pixel that is at least as high as its eight neighbours is a candidate. They are taken in order, highest first.
4. Enough localizations? For each candidate the localizations within count radius (75 nm) are counted. A candidate with fewer than minimum count is dropped: that is what removes the many small maxima of the background.
5. Re-centring. The candidate is moved to the mean position of those localizations, which is more precise than the pixel it was found in. The count is checked again at the new centre.
6. Separation. A candidate closer than separation (150 nm) to a site already accepted is dropped. Because the highest peaks come first, of two maxima on one structure the stronger one wins. ROIs that are already in the file count as accepted too, so running the plugin a second time adds only what is new.
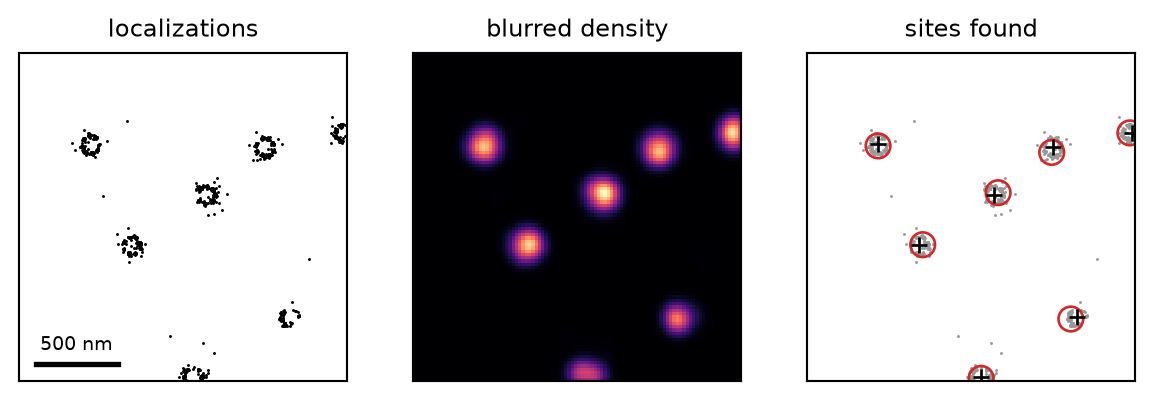
Simulated nuclear pores (Nup96, 60 % labelling) in a 2 µm piece of the field. Left: the localizations. Middle: the blurred density image the maxima are found in. Right: the sites found (circles: the count radius) and the true pore centres (+). Every pore is found, and nothing else.
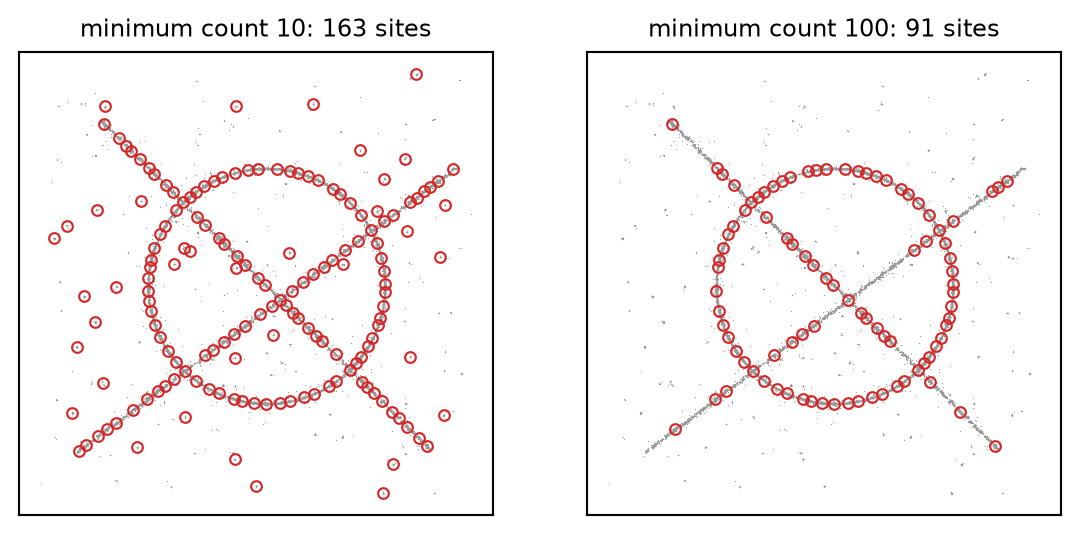
The same plugin on the ring and crossed lines of the demo structure, with a minimum count of 10 (left) and 100 (right). It finds density, not shape: sites line the ring and the lines at about the separation, and at the low threshold also land on the scattered background molecules.
The image. Only localizations with finite x_nm and y_nm are used; if there are fewer of them than minimum count, nothing is proposed. The image covers the localizations plus a margin of  on every side (
 the smoothing,
  the bin), so that a structure at the edge of the field still gets its full peak; outside the image the density is taken to be zero. The image may have at most 16 million pixels (for 20 nm pixels, a field of 80 µm by 80 µm); a larger one is refused with a request to increase the bin.
The maxima. A pixel is a maximum when it equals the largest value in its  neighbourhood and is above zero. A flat top of several equal pixels that touch is one maximum, placed at their mean position. Maxima are ordered by the height of the blurred density, ties broken by position, so the result does not depend on the order of the table.
Counting and re-centring. With  the centre of the maximum's pixel and
  the localizations within the count radius
  of it, a candidate needs
  . It is then moved to
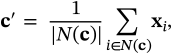
and must pass the same count at  . The mean is taken over the compact neighbourhood rather than over the analysis ROI, so a neighbouring structure just outside
  does not pull the centre. It is still a mean of what was detected: on an incompletely labelled pore the centre moves towards the labelled side, by about 15 nm (median) in the simulation above. An evaluator that fits a model to the site refines it further.
Separation.  is rejected if it lies closer than the separation to any accepted centre, including the centres of the ROIs already in that file. This is a greedy non-maximum suppression in nanometres: which of two close candidates survives is decided by the order, highest density first.
What it runs on. In the ROI manager, the plugin runs on the file being shown, on its localizations after the layer's filters, and on its grouped localizations when the layer is grouped. The new ROIs get the manager's global size and shape (a circle of 300 nm by default), which has nothing to do with the count radius: detection and analysis are set separately. Each ROI records how it was found: this plugin and its version, its settings, the filters and the grouping.
The defaults suit compact structures of about 100 nm, such as nuclear pores.
| setting | default | what it does |
|---|---|---|
binbin_nm | 20 nm | Pixel size of the density image the peaks are found in. Smaller than the smoothing, or the blur has nothing to smooth over; 10 to 25 nm is typical. Only the speed and the memory depend on it much. at least 0.1 nm |
smoothingsigma_nm | 50 nm | Gaussian blur applied before looking for maxima. About the radius of the structure. Much smaller splits one structure into several maxima (the separation then has to remove them); much larger merges neighbouring structures into one. at least 0.1 nm |
separationseparation_nm | 150 nm | Reject a peak this close to one already accepted. A bit more than the diameter of the structure and less than the typical distance between two of them. Too small gives two sites on one structure; too large loses one of two close neighbours. at least 0.1 nm |
count radiuscount_radius_nm | 75 nm | Localizations within this radius must reach the minimum count. About the radius of the structure plus the localization precision, so that the count and the re-centring see the whole structure but not its neighbours. at least 0.1 nm |
minimum countmin_count | 10 | A peak with fewer localizations is not a site. The most useful setting for a given data set: it separates structures from background. Look at how many localizations a real site has (Statistics reports it) and set it well below that, and well above what a patch of background of the same size holds. at least 1 |
A good result has one site on each structure and none on the background. Sites on empty background: raise minimum count. Faint structures missed: lower it. Two sites on one structure: raise separation or smoothing. Two structures under one site: lower them.
Run without the ROI manager (from a script, Context(locs=locs)), it returns only the list of centres, in data["centers"].
SMAP has no single counterpart; its segmenters are specific to a structure. This plugin replaces the generic part of ROIManager/Segment/segmentCME and segmentNPC (Ries 2020).
segmentCME) or a ring filter and a difference of Gaussians (segmentNPC), and keeps those above an intensity cutoff. Here the threshold is a number of localizations within a radius in nanometres, which does not change with the pixel size, the blur or the rendering.