ROIManager › Evaluate · version 1 · runs once per ROI
Counts a site's localizations and averages their precision and photons.
Once the ROI manager has a list of sites – found by Density Peaks or drawn by hand – each site is evaluated: a plugin looks at the localizations inside one ROI and returns a row of numbers for it. The rows of all sites together make the site table, which the Analyze plugins, such as Histograms, summarise.
Statistics is the simplest evaluator. A new pipeline starts with the general evaluators, and in a plain installation that is this one. For each site it reports three numbers: how many localizations it holds, their mean localization precision and their mean photon count. They are the first thing to look at in a set of sites: a count far from the others marks a site that is empty, doubled or sits on background, and the precision and photons say whether the sites were imaged alike.
It needs photons and the precision column (xy_err_nm by default) in the table. A site where one of them is missing gets an error instead of a row, and the other sites carry on.
1. The site's localizations. The ROI manager cuts out the localizations inside the ROI: a circle of 300 nm by default, or the ROI's own square or polygon. They are the localizations the layer shows, after its filters, and one row per blink when the layer is grouped.
2. The numbers. Statistics counts them, and averages the precision column and photons over them.
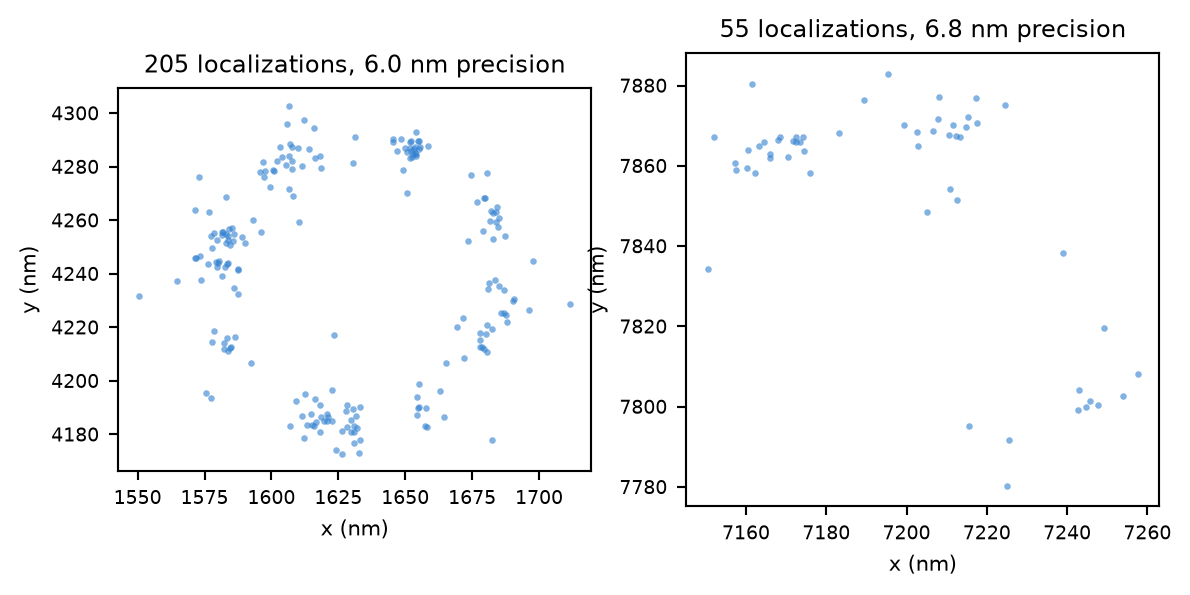
3. The figure. The site is drawn as its localizations, with the count and the precision in the title. The ROI manager redraws it for each site as the list is walked through. The three numbers cannot tell a ring from a smear of the same size; the picture can.
The figure Statistics draws, for the site with the most (left) and the fewest (right) localizations among the simulated nuclear pores. Both are single pores: the left one shows 25 fluorophores, the right one 9 of its 32 Nup96 copies – labelling is random, and so is how often a dye blinks.
For a site with localizations  it reports

where  is the precision column and
  the photons. The means are arithmetic, over the finite values only:
  and
and  are how many of the
  values were finite, and are reported beside the means (
mean_precision_nm_n, mean_photons_n). They differ from  only when the table holds
 NaNs, for example from a fit that failed to give a precision. An empty site has  and
and NaN means, and no figure.
The mean precision is the mean of the per-localization precisions, not the precision of the site's centre, which is much smaller. On a grouped layer each row is a whole blink, so  counts blinks,
  is a blink's summed photons and
  the precision the grouping gave the blink.
The evaluation of a site is recorded with this plugin's name, version and settings, and with the site's inputs (the file, the ROI, the filters, the grouping). When any of them changes, the stored row is out of date and is left out of the site table until the site is evaluated again.
| setting | default | what it does |
|---|---|---|
precision columnprecision_column | xy_err_nm | The column averaged as the site's localization precision.
|
One row per site, in the site table, with the columns
n_localizations: the number of localizations (or blinks) in the ROI;mean_precision_nm: their mean precision, and mean_precision_nm_n the number of finite values it is the mean of;mean_photons: their mean photon count, and mean_photons_n likewise.The text says how many localizations the site has, and the figure shows them. In a set of similar structures the counts scatter widely – the labelling, the number of blinks and the photons all vary from site to site – so look for the outliers rather than the spread: a site with a fraction of the typical count, or several times it, is worth a look before it goes into an average.
Based on SMAP's ROIManager/Evaluate/generalStatistics (Ries 2020).