Analysis › Measure · version 4
A fit of a simulation against where the molecules really were.
On real data nobody knows where the molecules were, so a fit can only be judged by how the picture looks. A simulation does know: every fluorophore, every frame it was on in, how many photons it gave. Ground Truth uses that to score a fit of a simulation. It pairs each localization with the true spot it came from and reports two things:
Use it to test a fitter or its settings on data where the answer is known, to see what a filter on fit quality costs and gains, or to check that the precision a table reports can be trusted before relying on it in an analysis. It is of no use on real data.
What it needs. A table that came from a simulation, in nanometres (x_nm, y_nm, frame):
*.sim.yaml opened in a fitter, which writes the file's name into the table as its source;The truth is not stored with the table. It is worked out again from the simulation's settings and seed, which fix it exactly and take about a second to redraw. A fit that names a *.sim.yaml that has since been moved is refused with a message saying so; name the file under simulation.
The comparison takes a fraction of a second. For the precision to be scored, the table needs x_err_nm and y_err_nm, or xy_err_nm for both (and z_err_nm for z).
1. The truth. The simulation is run again, up to the point where the camera frames would be drawn, and every spot in every frame becomes a row: where the fluorophore was (drift included, if the simulation had drift), how many photons it emitted in that frame, and how far away the nearest other spot on in the same frame was. Only the frames from the table's first to its last are used, so a fit of part of a stack is scored against that part.
2. Which true spots count. A fluorophore that switched on for a sliver of a frame gave a handful of photons, and no fitter finds it. Counting it as missed would measure the simulation, not the fit. So only true spots with at least count spots from photons (100 by default) are counted. With isolated spots only, only spots with no other spot within 1 µm in their frame count, which measures the fit without crowding. An ROI drawn in the render window limits the truth as well as the localizations, so the score is of what is being looked at. Every true spot still takes part in the pairing; the rule only decides which are scored.
3. Pairing, frame by frame. In each frame, localizations and true spots are paired one to one: each localization with at most one spot, each spot with at most one localization. Of all the ways to do that, the one taken pairs as many as possible and, among those, keeps the total distance smallest. No pair may be further apart than match within (100 nm); with and in z within set, a pair must also agree that well in z. Matching on the least total distance matters where spots are close: taking the nearest pair first can leave a second localization with no partner that it would otherwise have had.
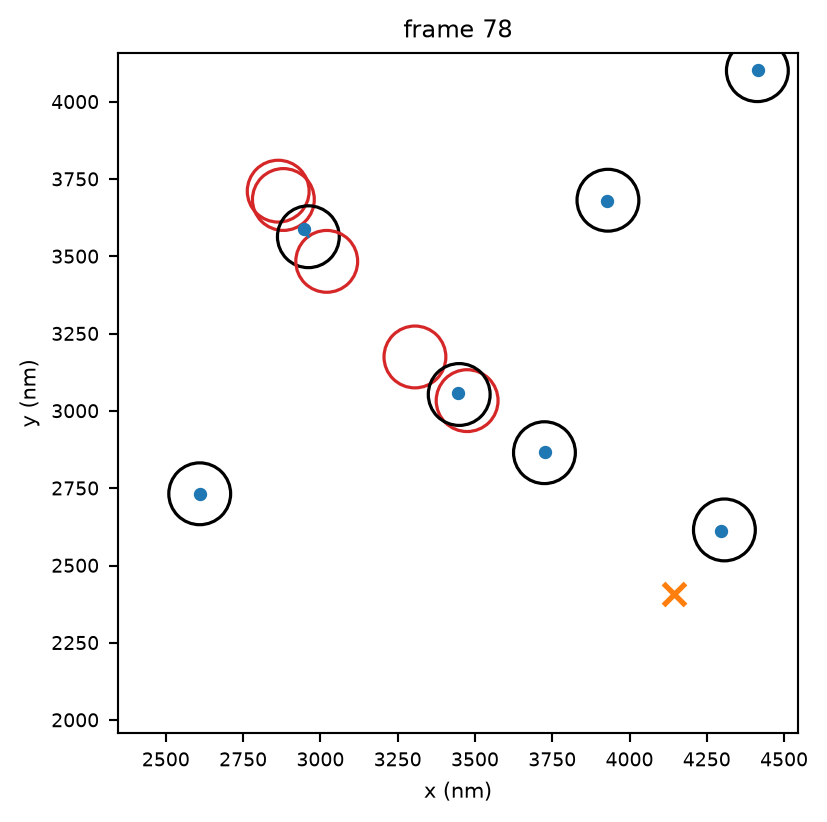
The crowded part of one simulated frame. Circles: true spots, drawn with the 100 nm radius a partner must lie within. Blue dots: localizations, joined to their partner. Where two or three emitters were on close together they were fitted as one localization between them: it pairs with one of them, and the others count as missed (red). The orange cross is a false localization added by hand, with no spot near it.
4. Found, false, missed. A pair whose true spot counts is a found molecule (a true positive). A localization with no partner is false (a false positive), and a counted spot with no partner is missed (a false negative). Some localizations are neither right nor wrong and are set aside: those paired with a spot that does not count, and those left without a partner that lie next to such a spot or are themselves dimmer than count spots from. Without this, raising the photon threshold would turn good fits of dim spots into false positives.
5. The Jaccard index. Detection in one number: the found molecules over everything that is found, false or missed. It is 1 when every counted molecule was found and nothing else, and it falls with false localizations and missed molecules alike. It is what a filter on fit quality should be judged by: tightening the filter removes false localizations and also found ones, and the Jaccard index says whether the trade paid.
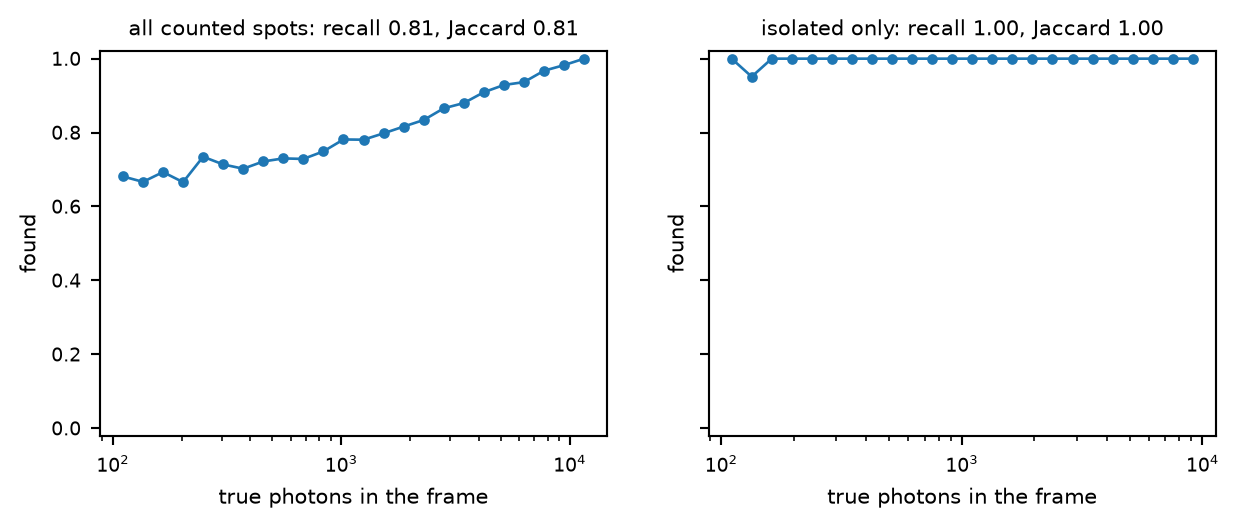
The fraction of true spots found, by the photons they emitted in the frame (the first panel of the plugin's figure), scored on every spot from 100 photons (left) and on isolated spots only (right). In this dense simulation the dim spots are missed most often, and it is crowding that misses them: two emitters on close together were fitted as one spot at their photon-weighted mean, nearer the brighter one, which takes the pair. Isolated spots are found whatever their brightness.
6. How far off. For every found molecule the error is the fitted position minus the true one, per axis. Its mean is the bias, a systematic shift that a good fit does not have. Its root mean square is the RMS error, the typical distance from the truth, bias included.
7. Is the precision honest? Every localization carries a precision, the error the fit believes it has (x_err_nm, y_err_nm, z_err_nm). Dividing each error by its own precision gives a number that should scatter like a standard normal distribution – spread 1 – when the precisions are right. The plugin reports that spread as error / reported precision. Above 1, the localizations are worse than they claim, and anything that weights by precision (grouping, a line profile, a drift correction) trusts them too much. Below 1, they are better than they claim. The spread is measured robustly, so a few wrong pairs do not change it. A bias widens it too, since a shift of a few nanometres is several times the precision of a bright spot and a fraction of a dim one's.
8. The z scale. With z in both, fitted z is plotted against true z and a straight line fitted. Its slope is the scale of the axial calibration: 1 is right, below 1 the fitted z range is compressed. Crowded spots pull astigmatic z towards the focus and so lower the slope, which is one reason to look at isolated spots too.
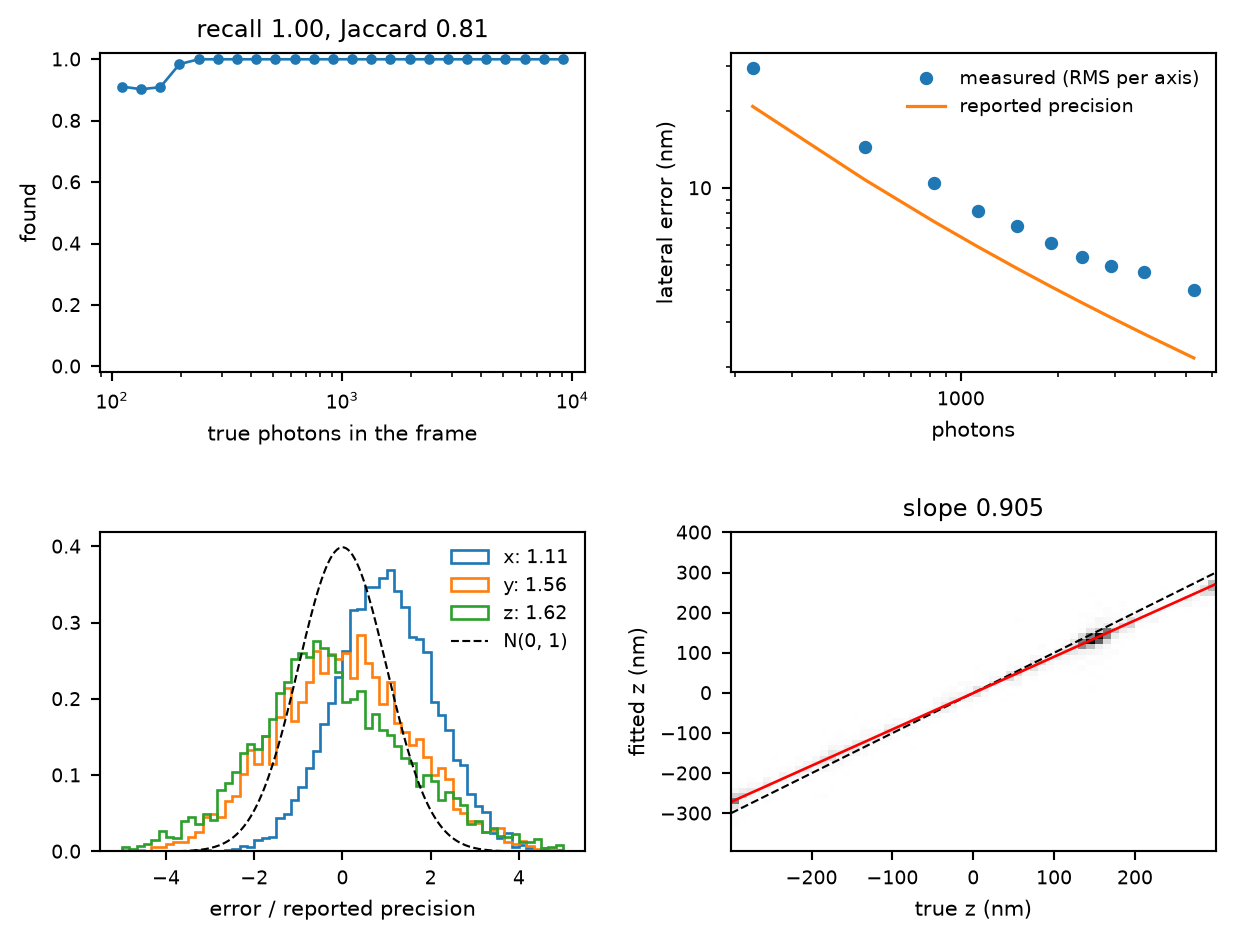
The plugin's figure for the simulated table spoiled in known ways, scored on isolated spots: x shifted by 4 nm, extra noise on y of 1.2 times the precision (so a spread of  ), z compressed to 90%, and 5% false localizations at random places. Top right: the measured error lies above the reported precision, most of all for the bright spots, whose precision is smallest next to the 4 nm shift. Bottom left: the x errors are shifted, the y errors too wide, and the z errors widened by the compression. Bottom right: z on a slope of 0.9. The false localizations lower the Jaccard index below the recall, and the extra noise takes a few of the dimmest spots beyond 100 nm, where they count as missed.
9. Crowding, and isolated spots. Two molecules on close together in one frame are fitted as one spot, or twice with each fit pulled towards the other. Their errors are larger than their precision says. With isolated spots only, the score is of the spots that had no neighbour within 1 µm, and localizations near the crowded ones (within 500 nm, or match within if that is larger) are set aside. Comparing the two scores separates what the fitter does on a clean spot from what crowding does to it.
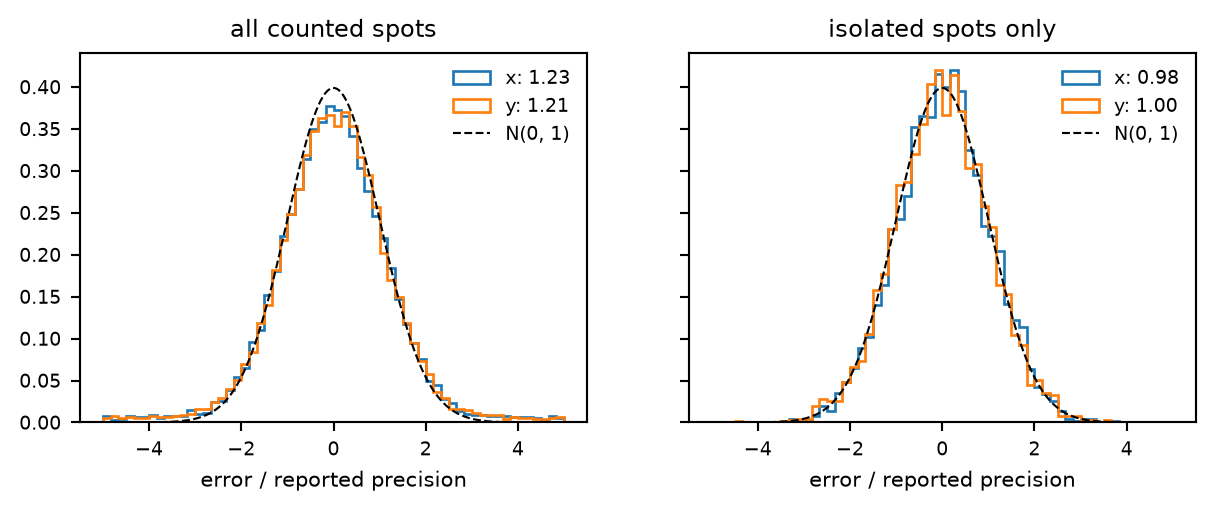
Error over reported precision in x and y for the same fit, scored on every spot from 100 photons (left) and on isolated spots only (right). The localizations fitted between two close emitters widen the distribution on the left; the isolated spots scatter as the unit Gaussian (dashed).
The truth table. The simulation settings come from the file named in simulation, else from the *.sim.yaml in the table's source, else from the simulation_settings a simulated table carries. From them the ground truth is redrawn (simulate.ground_truth) and turned into one row per spot per frame (camera_truth): x_nm, y_nm, z_nm including the simulated drift, photons emitted in that frame (the expected number, before shot noise), and neighbour_nm, the distance to the nearest other spot in the same frame. With drift corrected, the simulated drift of each spot's frame is subtracted from its position, the table is matched against that, the mean offset of the pairs in each axis is taken out of the truth as well, and the table is matched again.
Which spots count. True spot  counts when

with  and
and  the first and last frame of the whole table,
  the photons it emitted in its frame,
  count spots from, and the last condition, on the neighbour distance
  , only with isolated spots only. The layer's filter applies to the localizations only.
Pairing. In each frame that has both, the candidate pairs are those within the radius  (match within), found with a k-d tree, and, with a z radius
  , also with
 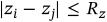 (applied only when both tables have
 z_nm). The cost of a candidate is its lateral distance  ; every other pairing costs
  . The assignment of least total cost (
scipy.optimize.linear_sum_assignment, exact) is taken and the pairs of forbidden cost are dropped. Because a forbidden pair costs more than any sum of allowed ones, this is the largest set of allowed pairs, and of those the one of least total distance. A frame with one localization and one spot pairs them if they are within reach.
The counts. With  the pairs,
  the counted spots:
 ;
; ;
; , plus every unpaired localization that has a spot not in
  within
  in its frame, or has fewer than
  photons (when the table has
 photons).  is
is  , or
, or  with isolated spots only;
 , the unpaired localizations not set aside.
A localization that is paired with a counted spot is found, however dim it was fitted. Then

The text reports the false fraction,  ; "correct" is what the SMLM challenge calls precision, a word kept here for the localization precision.
Accuracy. Over the  found pairs, with
  the fitted minus the true coordinate:

The RMS error therefore contains the bias:  . x is divided by
 x_err_nm, y by y_err_nm and z by z_err_nm, for the pull  (pairs with
  left out), and the reported spread is the scaled median absolute deviation

which is the standard deviation for a Gaussian, ignores a few wrong pairs, and is unmoved by a shift common to all  – though not by a bias in nanometres, which is a different
  for every precision. Each axis by its own precision, because an astigmatic spot is narrower in x than in y on one side of focus and the other way round on the other: divided by
 xy_err_nm, the RMS of the two, a spline fit to frames drawn from its own PSF read an x pull of 0.86 to 0.96. A table with xy_err_nm only has both axes divided by it. An axis without a precision column has bias and RMS only.
The z slope. With more than 10 found pairs, z_nm in both tables and true z not all equal, the least-squares line  gives the slope
  and the offset
  .
.
The figures. The recall panel bins the counted spots' true photons in 24 logarithmic bins from the dimmest (at least 1 photon) to the brightest, and draws the fraction found in each non-empty bin. The error panel, drawn with at least 20 found pairs, splits them into ten equal-sized groups by their fitted photons and draws, per group, the measured error per axis 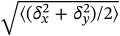 against the median reported precision per axis,
 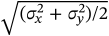 (which is
 xy_err_nm). The pull panel has 60 bins from  to
to  , with the standard normal density dashed. The z panel is a 60 by 60 histogram of fitted against true z, with the identity dashed and the fitted line drawn over the 0.5th to 99.5th percentile of true z.
Compared with the challenge. The SMLM challenge (Sage et al. 2019) also pairs frame by frame and scores recall, precision, the Jaccard index and the RMS error. Its assessment differs from this one in four places:
| setting | default | what it does |
|---|---|---|
simulationtruth | – | Auto: the simulation the table was fitted from, or the one that made it. Needed for a table fitted from the TIFF a simulation also wrote (its |
match withinradius_nm | 100 nm | A localization and a true spot in one frame closer than this can be the same molecule; paired one to one. A few times the localization precision, and well below the distance between spots in a frame. Too small, and a poorly fitted spot becomes one false and one missed; too large, and a false localization is paired with a missed spot nearby and counted as found, with a large error. at least 0.1 nm |
and in z within (more)z_radius_nm | auto | Auto: lateral only; otherwise a pair must also agree in z this well (SMAP: 300 nm). For 3D data, where a spot fitted at the wrong z – on the wrong side of focus, say – would otherwise count as found and only show as a large z error. at least 0.1 nm |
count spots frommin_photons | 100 photons | True spots with fewer photons in the frame are not counted, and what was fitted to them, or fitted as dim itself, is set aside: a fluorophore on for a sliver of a frame is found by no fitter, and a simulation keeps its dim localizations. It compares the true photons of a spot, what the fluorophore emitted in the frame. The fitted photons of a localization only decide whether an unpaired one is false or set aside, so a false localization dimmer than the threshold is never counted as false: a fitter that makes many dim false detections looks clean at 100. At 0 every spot counts and every unpaired localization not beside an uncounted spot is false; the recall figure shows from how many photons on the fit finds its spots. |
isolated spots onlyisolated | off | Count only true spots with no other within 1 um in their frame, and set aside what was fitted near the rest: the accuracy without crowding. 1 µm is the distance the simulation calls isolated: nearer, a neighbour's light falls into a fit's 13-pixel box. |
drift correcteddrift_corrected | off | The table's drift has been taken out: compare with the truth without it. The truth includes the simulated drift, and a table that has been drift corrected no longer does; tick it after a drift correction. A drift correction measures drift only up to a constant – RCC and COMET make it average zero over the acquisition, while the simulated drift starts at zero – so a corrected table sits a constant offset from the truth that nothing in it can tell. That offset is measured from the pairs, taken out, and reported; the bias of a drift-corrected table is therefore zero by construction and says nothing, while the error / reported precision above 1 that remains is the drift correction's own error. |
A good fit of an honest simulation has a recall and a Jaccard index near 1 on the isolated spots, biases well below a nanometre, an error / reported precision near 1 (the measured-error points on the precision line) and a z slope near 1. A bias of tens of nanometres usually means the table and the truth disagree about something other than the fit: a drift correction without drift corrected, or a pixel convention. An error / reported precision well above 1 on isolated spots means the fitter's precision cannot be trusted; if it is near 1 there and above 1 on all spots, the excess is crowding.
Does the job of SMAP's other/CompareToGroundTruth (Ries 2020), which compares two loaded layers, one of which is the ground truth. Here:
matchlocshd takes the candidate pairs of a frame nearest first, skipping any whose partner is taken, which can pair fewer spots in a crowded frame.